

Ever notice how the market can seem almost alive? One minute, stocks burst like fireworks, and the next, they fall hard. This happens because economic numbers, company news, or even investor moods can change in an instant. Think of it like a heartbeat that speeds up when you're excited, markets can make sudden moves too. In this piece, we'll break down the reasons behind these rapid changes and show how everyday events can spark big market moves. Stick around to get a clear view of how market ups and downs work.
Core Drivers of Market Volatility
Market volatility shows how fast and by how much asset prices change. When prices jump quickly, that means high volatility. Slower, smoother moves mean low volatility. Think of it like the market’s heartbeat – sometimes fast and exciting, and other times calm and steady.
It’s important to measure these changes so we can understand how the market works. Experts use a tool called standard deviation, which just means they look at how spread out returns are compared to the average. Another tool is the VIX Index, often called Wall Street’s "fear gauge." This index gives a simple peek into how much prices might swing in the near future. These measurements help investors know how lively the market is and get ready for any big moves.
Real-world examples make this clearer. For example, when Apple reported better-than-expected earnings, its stock jumped almost 5% in a single day. That big jump shows how suddenly good news can boost the market. In another case, when inflation data wasn’t as expected, the S&P 500 dropped fast, proving that even small differences from predictions can lead to dramatic reactions.
A mix of economic news, investor feelings, and unexpected events sparks market volatility. News about inflation or job numbers can change how investors feel about the market, causing quick price changes. All these factors work together to create the ups and downs we see in the market every day.
Economic Data as Stock Instability Triggers

Economic data releases have a big impact on how markets swing. Think about key reports like inflation, job numbers, or GDP growth acting like switches that change investor moods. When the numbers come out different than expected, it creates a noticeable gap between what people thought and what really happened. For example, a surprise jump in the Consumer Price Index (CPI) during Q2 2023 pushed bond yields up and stocks down. It’s like stepping out expecting a gentle breeze and suddenly being hit by a strong gust.
Macroeconomic reports often hint at what’s coming next. When figures for jobs or GDP growth stray from expert predictions, investors quickly make changes to their positions. Imagine planning your day around clear skies, only to see dark clouds rolling in, everyone has to change their plans right away.
Then there are the central bank rate-change announcements. They add extra fuel by either smoothing out or heightening economic shocks. This, in turn, boosts the level of uncertainty felt by everyone in the market. Each report reminds us just how much a few simple numbers can turn calm conditions into hectic, rapidly changing moments.
Geopolitical Risk Drivers and Global Events Disruption
Political events and global crises can change market trends almost overnight. Wars, elections, and trade tensions make investors uneasy and often push them toward safer choices. When political uncertainty sets in, many prefer moving money from stocks to steadier options like gold, bonds, or cash. Even a surprising election result or a rising trade dispute may lead to a quick shift away from riskier investments.
Natural events also affect market behavior. For example, powerful hurricanes or unexpected earthquakes often cause rapid sell-offs as investors react to sudden instability. In some cases, news about intensifying trade disputes hits emerging markets especially hard, prompting a pullback from equities. In truth, this mix of political moves and global events creates a setting where any unexpected change can trigger sudden swings and force shifts between different asset classes.
Overall, these factors highlight why political instability and major global events can so quickly change market sentiment and investment strategies.
Investor Sentiment Influence on Market Volatility
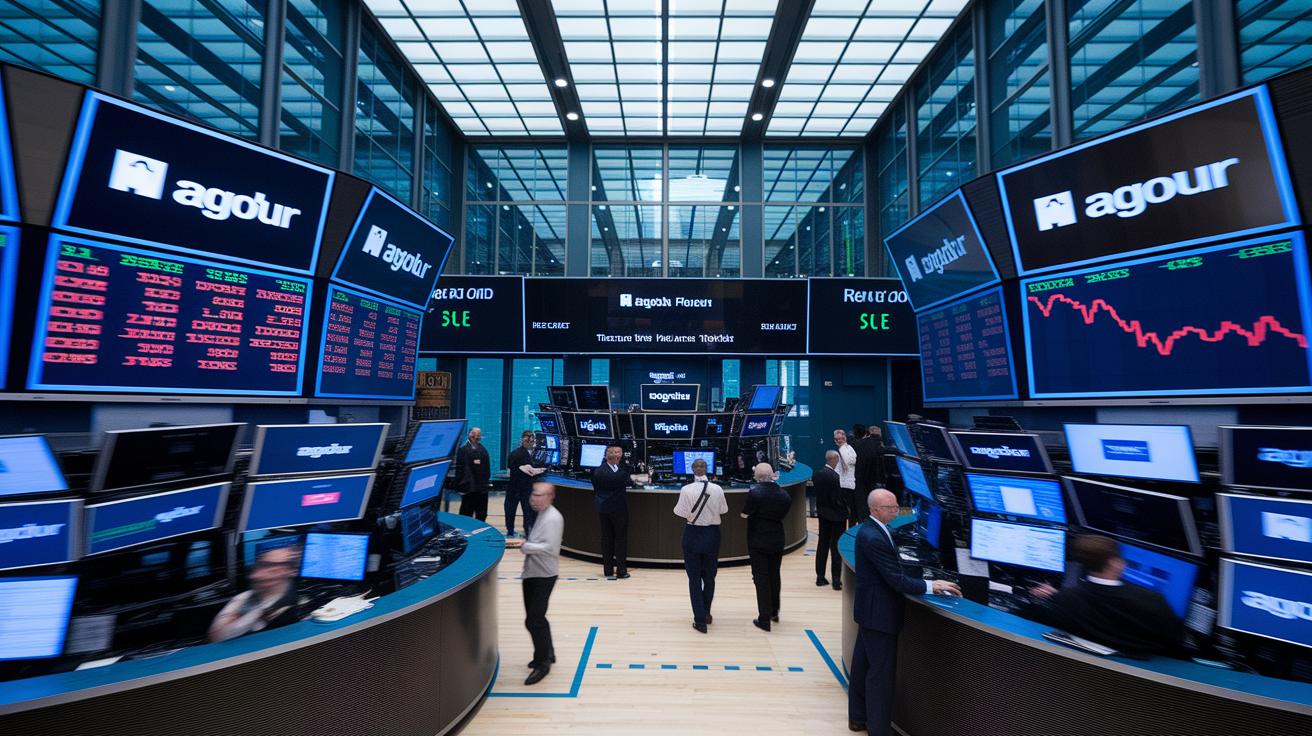
Market ups and downs are more than just numbers. They come from our feelings and fast computer trades. When people get scared, they might rush to sell. And when they feel overconfident, they can make risky bets that look too good to pass up. Even computer orders that happen in a split second can supercharge these moves.
Imagine a small drop in a stock’s price setting off a chain reaction. Computers start trading fast while people scramble to sell, turning even little changes into big shifts. Here are some feelings that fire up the market:
- Fear-driven sell-offs
- Greed-fueled buying sprees
- Panic during downtrends
- FOMO rallies (fear of missing out)
- Overconfidence leading to risky bets
It’s like being in a room where one person’s worry makes everyone jump, sparking more rapid changes. Next time you see the market acting wild, remember it’s a mix of our shared feelings and quick computer moves that create those rocky moments.
Technical Factors and Volatility Metrics Overview
Technical indicators help us understand the market's movement by revealing what sparks price changes. One well-known measure is standard deviation. It shows how much returns stray from the average, kind of like seeing how marbles are scattered in a jar.
Another handy tool is the VIX Index, which looks at 30-day implied volatility on S&P 500 options. When you see the VIX climbing, it means traders expect larger price shifts. Flash crashes, on the other hand, happen when there is little liquidity and speedy algorithmic trades, causing prices to plunge and bounce back in seconds.
Sudden surges in trading volume often hint at quick changes in market energy before or after big price gaps. These technical tools work together to map out the market's rhythm, helping investors decide when to jump in or step aside.
| Indicator | Function |
|---|---|
| Standard Deviation | Shows how much prices deviate from the norm |
| VIX Index | Gauges expected price swings based on options data |
| Flash Crash Events | Sudden, rapid price drops and quick recoveries |
| Algorithmic Volume | Highlights the impact of fast, computer-driven trades |
| Trading Volume Surge | Signals shifts in liquidity and momentum |
These measures offer a clear picture of market behavior, making it easier for investors to navigate fast-changing conditions.
Historical Trend Analysis of Volatile Market Conditions

When we look back over time, market ups and downs always bring their own warning signs. For instance, a $10,000 investment in the S&P 500 grew nicely over 20 years, even though it faced sharp drops along the way as of September 30, 2025. Think about events like the dot-com bust or the 2008 global market crash; these moments show repeated risks and shed light on some weak spots in our financial system.
These shocks, whether from rapid tech changes or major economic challenges, can stir up quick bursts of instability that unsettle investors. During these periods, a mix of stocks, bonds, and cash has helped many smooth out short-term losses. Plus, expert advice has been crucial in helping people set their own risk levels and reserve emergency funds, which are key during choppy times.
Studying past trends reminds us that market swings are part of a larger cycle. Once we grasp these patterns, we see that enduring these short-term bumps might open the door to long-term growth.
Final Words
In the action, we explored how earnings surprises, economic data, global events, investor mood, and technical factors shape market shifts. We broke down key concepts like standard deviation and the VIX to show what causes market volatility and its impact on your investments.
We looked at clear examples, like a strong earnings report or unexpected inflation, and historical trends that help put today’s moves in perspective. Embracing these insights can boost confidence and guide sound investment choices for a brighter financial outlook.
FAQ
What causes market volatility today?
The causes of market volatility today include unexpected economic data, political events, and rapid shifts in investor sentiment, all of which can lead to sudden price changes that affect market confidence.
What causes market volatility in stocks?
Market volatility in stocks is driven by factors such as surprise earnings reports, inflation data discrepancies, central bank moves, and quick algorithmic trading that can spark both sharp rallies and sell-offs.
What does a PDF on market volatility include?
A PDF on market volatility usually explains key concepts like asset price swings, measurement tools such as standard deviation and the VIX index, and concrete examples like stock movements after earnings reports.
What affects volatility in chemistry?
In chemistry, volatility is determined by a substance’s propensity to switch into a gaseous state, which is influenced by factors like molecular structure and temperature, differing from financial market volatility.
What is the 7% rule in the stock market?
The 7% rule typically refers to an approximate average annual return expected from the stock market over the long term, serving as a general guideline rather than a strict promise of gains.
Who owns 90% of the stock market today?
Institutional investors, including mutual funds, pension funds, and ETFs, hold nearly 90% of the market, reflecting a concentration of ownership that shapes market behavior and stability.
What does Warren Buffett say about volatility?
Warren Buffett emphasizes that volatility is a normal part of the market, suggesting that investors should focus on long-term value rather than reacting to short-term price swings.
What is the 90% rule in trading?
The 90% rule in trading indicates that a high proportion of trades may be unprofitable, underlining the importance of risk management and a robust trading strategy to balance the many smaller losses with a few big wins.

