
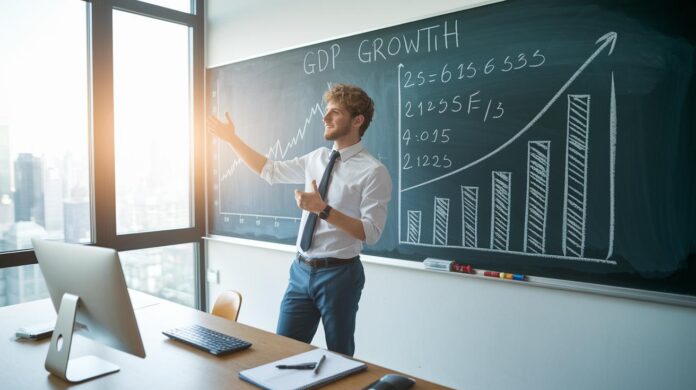
Ever wonder how a bit of math can show the health of our economy? Calculating the GDP growth rate isn’t just about crunching numbers. It gives you a clear snapshot of our country’s performance. In this post, you’ll discover simple steps to compare production numbers and tell if the economy is growing or shrinking. It’s like turning raw data into clear signals about progress, helping you understand your everyday financial life a little better.
Calculating GDP Growth Rate: Step-by-Step Overview
GDP shows us all the final goods and services made in an economy over a set time. It’s like taking a snapshot of how much is produced. When we adjust GDP for inflation, we call it Real GDP. This means we look at the true amount produced without the confusion of changing prices, for example, imagine counting apples without getting mixed up by their rising prices.
The GDP growth rate tells us how much the economy is growing or shrinking over time. We do this by comparing how much is made today with what was made before, then turning that change into a percentage. It’s a quick way for investors, government folks, and curious people to see how healthy the economy is. If more is made this quarter compared to the last, it shows that the economy is growing.
Here’s how you can calculate it:
- Get the GDP numbers for the current period and the one before.
- Find the difference by subtracting the earlier GDP from the current GDP.
- Divide that difference by the GDP from the previous period.
- Multiply by 100 to get a percentage.
- Adjust it for the time period, like turning a quarterly rate into an annual rate or comparing the same quarter from different years.
There are two common ways to look at it. One method uses seasonally adjusted data to show short-term changes. The other method compares the same quarter across years to smooth out any ups and downs. Both ways help us see what’s really happening with production.
GDP Growth Rate Formula Breakdown

When we work out how fast the economy is growing, we use simple symbols. We call the output for the current period Y_t and for the past period Y_{t-1}. Subtracting the previous from the current gives us the GDP change, noted as ΔY. To find the growth rate, we use this formula: (ΔY / Y_{t-1}) x 100.
For instance, if Y_t is 17,500 and Y_{t-1} is 17,000, the change (ΔY) is 500. That means the growth rate is (500 / 17,000) x 100, which comes out to about 2.94%.
| Component | Symbol | Description | Unit |
|---|---|---|---|
| Current GDP | Y_t | Output in the current period | Billion $ |
| Previous GDP | Y_{t-1} | Output in the previous period | Billion $ |
| GDP Change | ΔY | Difference between Y_t and Y_{t-1} | Billion $ |
| Growth Rate | g | (ΔY / Y_{t-1}) x 100 | Percent |
These symbols, like Y_t and Y_{t-1}, are common in many texts. Sometimes, you might see a different letter like G used to represent GDP. This makes it clear and easy to talk about changes in output over time.
Comparing Real and Nominal GDP Growth Rates
Real GDP measures how many goods and services an economy truly makes, using fixed base-year prices to remove the effects of inflation. In simple terms, think of it like counting the actual apples produced. Nominal GDP, however, multiplies today's prices by the number of apples, reflecting current prices that can fluctuate.
When prices increase, Nominal GDP might look higher than what actually happened in production. For example, if Nominal GDP shows a 4% rise but prices have inflated by 2%, the real increase in production, Real GDP growth, is closer to 2%. This matters because inflation can make the economy seem stronger than it really is.
Analysts usually lean toward Real GDP when they want to see changes in actual output without the noise of price changes. It’s especially useful for comparing past and present production or guiding long-term policy decisions. Meanwhile, Nominal GDP gives a quick peek at the current market size or spending power, even though it might overstate growth when prices rise.
Quarterly vs Annual GDP Growth Computation Methods

We measure GDP growth using two methods, one gives you a quick look at changes, and the other shows a smoother, long-term trend. Both methods have their own formulas and explanations.
For the quarter-on-quarter growth rate, we work with seasonally adjusted data so that short-term shifts come through clearly. The formula is simple: subtract last quarter’s value from this quarter’s, divide the difference by last quarter’s value, and multiply by 100 to get a percentage. You can then annualize this rate by either compounding the rate over four quarters or just multiplying it by 4. For example, if a quarter sees a 2.5% jump, compounding might result in a slightly higher annual growth than simply multiplying by 4.
The year-on-year growth rate looks at the same quarter over consecutive years. This helps cancel out seasonal bumps, giving you a steadier picture of the underlying trend. Many global reports and some economies favor this method because it naturally smooths out the ups and downs without needing extra adjustments.
Adjusting GDP Growth Using the GDP Deflator
Think of the GDP deflator as a handy tool that helps you see real growth by filtering out the effects of rising prices. It is calculated by taking the nominal GDP (which is the economy's value at today's prices) and dividing it by the real GDP (the value adjusted for price changes), then multiplying the result by 100. So, if the GDP deflator is 105, it tells you that prices have gone up by about 5% since the base year. This method makes sure that changes in price are not mistaken for actual growth in output.
To put this into practice, start by gathering the nominal GDP and the matching real GDP data. Then, use the formula (nominal GDP divided by real GDP, multiplied by 100) to get the deflator value. Next, adjust the nominal GDP by dividing it by the deflator and multiplying by 100 to get the real GDP figures. With this adjusted GDP, you can calculate the growth rate by comparing today's real GDP with that of an earlier period. This way, even if the numbers seem to indicate a big jump, a rising deflator might reveal that most of the increase comes from higher prices rather than a boost in actual production.
Spotting trends in the deflator is really important. A steady rise points to ongoing price increases, which means inflation is playing a big part. It’s a reminder to keep a close eye on inflation when you’re judging overall economic growth.
Worked Example: Calculating US GDP Growth Rate with 2015 Data
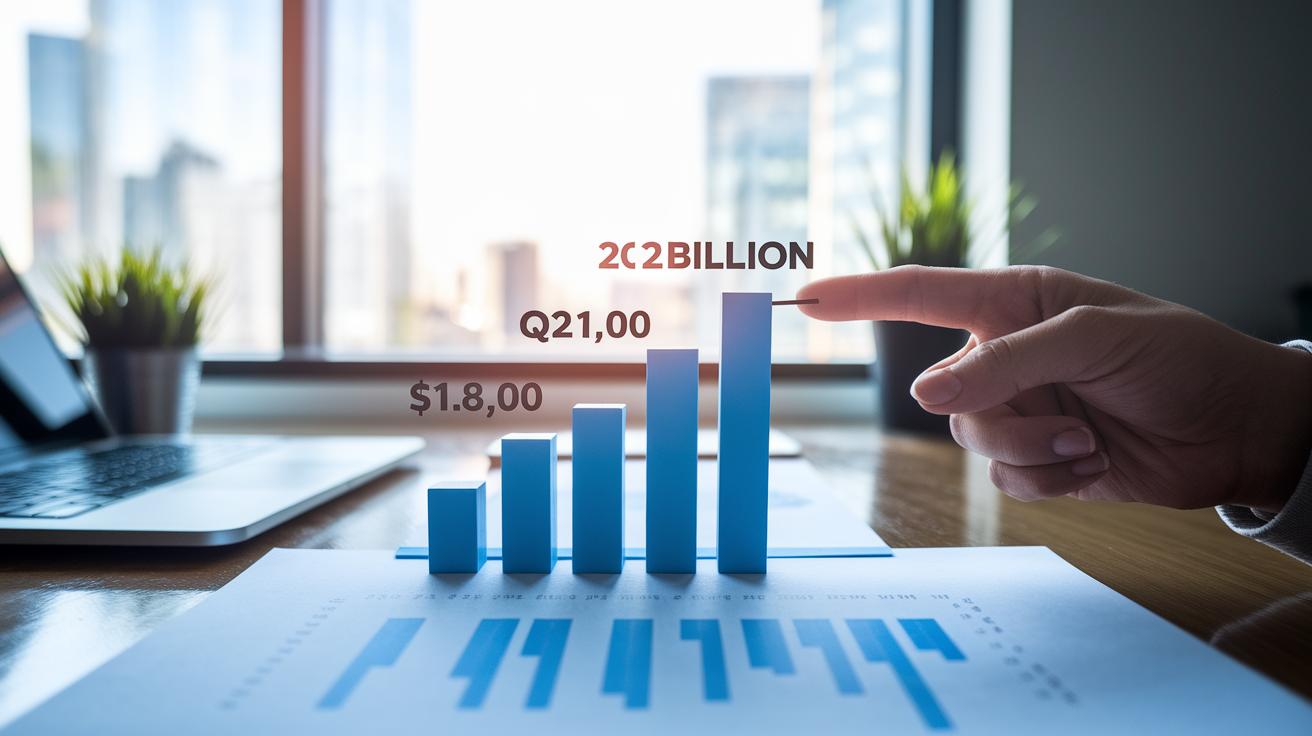
Back in 2015, Q1's real GDP was $17,900 billion while Q2's reached $18,100 billion. This example walks you through how to see the change in the economy by using a basic adjustment method.
To find the quarter-to-quarter growth rate, first look at the difference in GDP between the quarters. You subtract Q1’s $17,900 billion from Q2’s $18,100 billion, which gives you an increase of $200 billion. Next, divide that $200 billion by the Q1 figure of $17,900 billion. This gives a number of about 0.0112. Multiply that by 100, and you get a growth rate of roughly 1.12%. Imagine it like measuring how much extra work the economy did in Q2 compared to Q1.
Now, if you want to stretch that out over an entire year, assume the same growth happens every quarter. Raise 1.0112 to the power of 4, subtract 1, and then multiply by 100. These steps give you an annual growth rate of about 4.6%. This shows how small, steady gains each quarter can add up to a significant yearly increase.
For a year-over-year comparison, analysts typically compare Q2 2015 with Q2 2014. This method helps smooth out seasonal differences and offers a clearer look at the economy’s true progress over the same time each year.
Common Challenges in Calculating GDP Growth Rate
Early GDP numbers often get tweaked later, which means those first reports might not be spot-on. Think of it like catching a photo in the middle of a busy market; there’s a lot going on, and sometimes you might miss small details. Seasonal changes also play a part. For instance, during holiday times or when the weather shifts, businesses might naturally make more, throwing off simple quarter-to-quarter checks.
Then there’s the thing called rebasing. This is when the base year for measuring GDP shifts, making old growth figures look different, almost like changing the yardstick halfway through a race. And because each country sometimes updates their standards in its own way, comparing numbers between countries can be tricky. Analysts really have to be on their toes, balancing these differences just like adjusting a recipe when ingredients vary.
A good rule is to always work with the most recent data and compare apples to apples over time. By factoring in seasonal bumps and knowing how each place measures its growth, you get closer to seeing what’s really happening in the economy.
Final Words
In the action, we explored the steps and formulas behind computing GDP growth rates, from gathering key data and applying the GDP deflator to understanding real versus nominal calculations. We clarified how quarterly and yearly methods differ and discussed common challenges analysts face.
This guide walks you through how to calculate gdp growth rate while providing practical examples and clear steps. The insights shared boost confidence in making well-informed investment decisions and enable a positive outlook on your financial strategies.
FAQ
How do you calculate real and nominal GDP growth rates?
The calculation for both real and nominal GDP growth rates is done by subtracting the previous period’s GDP from the current period’s GDP, dividing that change by the previous period’s GDP, and multiplying by 100. Real GDP adjusts for inflation.
What is the formula for calculating GDP growth and the percentage change in GDP?
The standard formula is ((Current GDP – Previous GDP) / Previous GDP) × 100. This formula gives you the percentage change, which represents the growth or decline in GDP over time.
How do you calculate GDP growth rate in Excel?
In Excel, you calculate GDP growth by subtracting the previous period’s GDP from the current period’s GDP, dividing by the previous GDP, and formatting the outcome as a percentage for clear analysis.
How can you project future GDP using a growth rate?
To forecast future GDP, you multiply the existing GDP by (1 + growth rate/100). This method estimates the next period’s GDP based on the current growth percentage.
How is the GDP growth rate affected by population changes?
When adjusting for population, you divide real GDP by the total population. This per capita measure of GDP growth highlights economic changes experienced by each individual.
How was the GDP growth rate for 2021 calculated?
The 2021 GDP growth rate is computed using the standard method: determining the GDP change from one year to the next, dividing it by the previous year’s GDP, then multiplying by 100 to obtain a percentage.

