
Ever wondered if natural gas prices might change the market? Over the past few years, we've seen prices go up and down, but now things look like they're on the rise. Recent numbers show that when demand spikes, supply quickly adjusts, which helps keep prices steady. Some trends hint at a bright future thanks to these smart moves. Let's take a closer look at how these shifts could set the stage for a more positive market for natural gas.
Historical and Current Overview of Natural Gas Price Trends
Over the past twenty years, the natural gas market has really changed. Data from Macrotrends LLC, covering 1997 to 2026 and focusing especially on 2010 to 2026, shows a long stretch of steady moments mixed with sudden, wild swings. In the late 1990s and early 2000s, prices were pretty calm, setting things up for bigger changes later. Fun fact: in the 2000s, natural gas prices sometimes jumped over 30% in a single year!
In 2018, the market showed it could bounce back. Even when outside pressures shifted the balance, the supply of natural gas was able to adjust quickly to meet sudden demand. This period marks when smart supply strategies and new tech began steering pricing in ways we still see today.
Looking back over the decades, you can see a clear pattern of ups and downs. Early on, price changes were mostly due to shifting rules and basic market forces, while later, global economics and improved extraction methods played a bigger role. Each era brought its own set of challenges and chances for growth.
Here are some key turning points:
- 1997–2009: Early growth with mild ups and downs.
- 2010–2018: Increased volatility as demand surged.
- 2018–2026: Adjustments made for market shocks driven by global economic shifts.
These historical insights not only help us understand how natural gas prices have moved over time but also set the stage for analyzing today's price swings. Later sections will dive into current volatility and what the April 2025 Commodity Markets Outlook report suggests about the future.
Key Supply and Demand Dynamics in Natural Gas Pricing
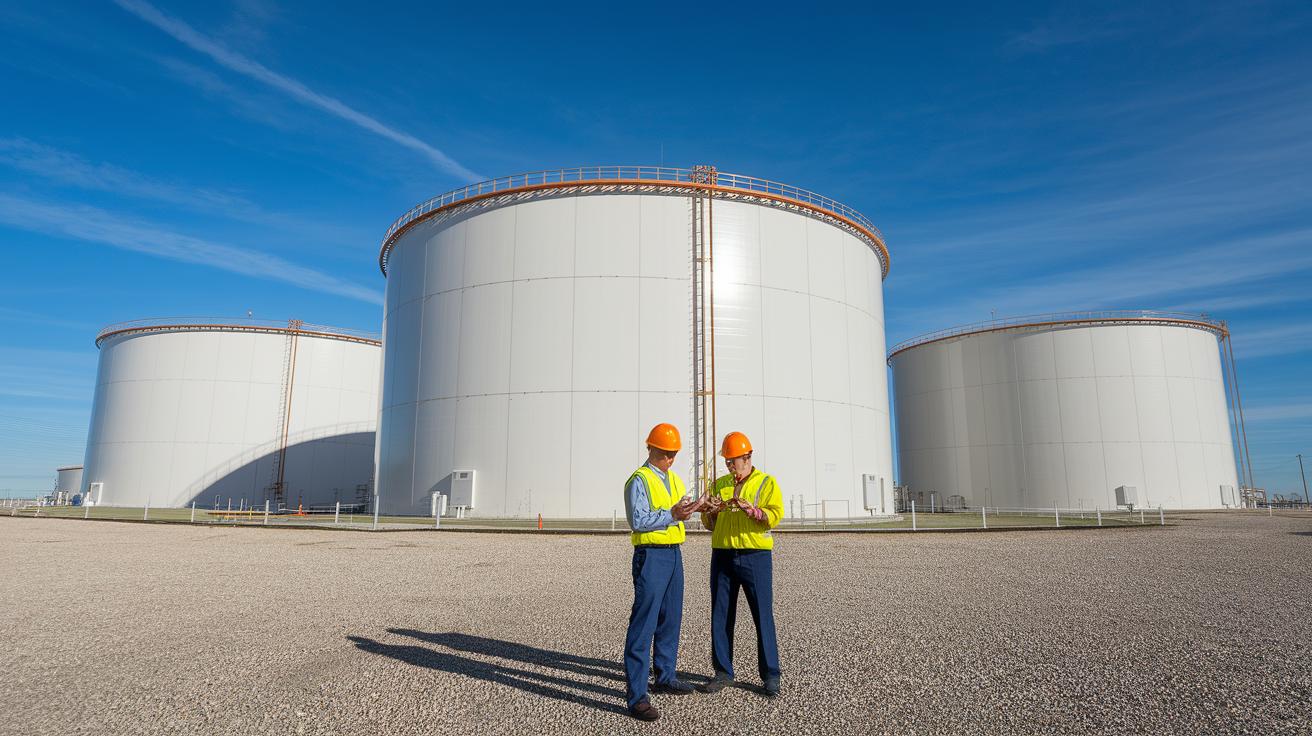
When you look at how natural gas prices change, it all boils down to supply and demand. Think of it like checking your pantry for essentials. When reports such as the API supply report show that storage levels are low, it hints that more people want gas than what’s available, which can push prices up.
Production matters a lot too. If there’s a slowdown because of routine maintenance or issues with equipment, the drop in production means less gas for everyone, so prices often go higher. On the other hand, if more gas is being produced, then the market gets a bit more balanced and prices can become steadier. In fact, recent outlooks for April 2025 have pointed out that changes in production really drive these shifts.
Usage trends also have a big effect. When factories or homes use more natural gas, it nudges prices higher, even if the stored amounts seem steady. But if usage slows down, prices might not jump as much.
Experts keep a close watch on these data points to predict price moves. Sometimes, even a small change in inventory can lead to noticeable price shifts, reminding us that every little bit in supply and demand can make a big difference.
Market Volatility: Spot, Futures, and Real-Time Natural Gas Price Tracking
Market ups and downs can feel pretty dramatic. In natural gas pricing, the spot market shows you current prices right away, much like glancing at a live score. And then there are futures markets, where traders use contracts such as those at Henry Hub and NYMEX to predict what’s coming next. Imagine checking a streaming price dashboard that refreshes every minute, you get a sense of the excitement just like watching a live game.
The spot market tells us how fast prices change when new news or inventory updates hit. A quick update from Henry Hub can ripple through the market in just minutes. Meanwhile, futures contracts help smooth out everyday price noise by focusing on long-term trends. For example, NYMEX contracts organize these bets to give traders a clearer idea of what the market expects overall.
These days, real-time price tracking tools have become more popular than ever. They offer a nearly live glimpse of pricing, which is especially handy when the market gets jumpy. Streaming dashboards capture every move as it happens, making it easier to figure out sudden shifts. For instance, when a price jump is reported at Henry Hub, traders immediately check their dashboard to understand the market pulse.
Here are some key points:
- Real-time updates show immediate market feelings.
- Spot market data captures quick shifts in supply and demand.
- Futures contracts, like those on NYMEX, provide a longer view of market expectations.
- Henry Hub remains a main point for price updates.
Keeping an eye on both spot and futures markets gives us a clearer picture of overall market volatility. Watching these trends together helps us understand the bigger picture and builds confidence in our view of natural gas price movements.
Short-Term and Long-Term Natural Gas Price Outlook and Projections
Recent research from the Commodity Markets Outlook (April 2025) shows that natural gas prices are slowly bouncing back over the next couple of years. Experts say that while there might be small bumps in the short run, the long-term picture looks brighter. The 2024 energy forecast remains pretty steady, with spot prices changing a little each day based on inventory shifts, production tweaks, and seasonal demand. Even a slight drop in supply can nudge costs higher in the short term.
Looking ahead to 2025 and 2026, the future trends seem more upbeat. As production gets fine-tuned and infrastructure upgrades come into play, the market is expected to enjoy more stable prices. A recent five-year study hints at a gradual positive shift in cost structures, which builds investor trust. It feels a bit like watching a garden grow – small daily improvements add up to a flourishing landscape over time.
There’s also a preliminary look at a 2030 forecast, offering a peek at what natural gas prices might be in the long run. This long-haul view suggests that a gentle recovery could smooth out any market bumps in the coming years. Investors are advised to keep an eye on both these near-term signals and the long-term projections when shaping their strategies.
| Forecast | Insight |
|---|---|
| 2024 Energy Pricing | Stable with minor daily shifts |
| 2025 Projection | Signs of improvement with production changes |
| 2026 Outlook | Gradual recovery and steadier prices |
| 2030 Forecast | Long-term stability with moderate recovery |
Each forecast carries some uncertainties, but by blending these short-term insights with longer-range predictions, there’s a solid signal of gradual improvement. This mix of cautious optimism and steady recovery can help investors feel more confident as natural gas markets adjust over time.
Geopolitical and Seasonal Factors Influencing Natural Gas Price Trends
Natural gas prices often change because of both the weather and happenings around the world. In the dead of winter, when it gets really cold, people turn up their heaters, and demand can jump quickly. I remember reading about one winter when the prices shot up by double-digit percentages because everyone needed heat right away. A heavy snowfall or a sudden frost can really turn the market on its head.
Changes in government rules also stir things up. When major exporters switch up their policies, it can change how much gas is available. New guidelines or relaxed rules push everyone to rework their ideas about future supply, which can lead to sudden price changes.
Then there are international issues. Sometimes, tensions like conflicts or trade disputes in key exporting countries make investors nervous. Even just the hint of instability can cause prices to rise as everyone braces for a possible disruption in gas deliveries.
Put it all together, and you see that natural gas prices are affected by predictable seasonal swings as well as unexpected global events. Key factors include:
- Seasonal demand jumps, especially during very cold or very warm spells
- Regulatory changes that shift production and export habits
- Global political events that can quickly unsettle supply chains
Each of these factors plays a part in a market that may seem volatile at times but also shows signs of long-term balance as supply routes adjust and policies settle over time.
Regional Comparison: U.S. Natural Gas Prices vs. Global Benchmarks
U.S. natural gas prices have been showing a bright outlook compared to the rest of the world. Locally, the Henry Hub spot price often sets the stage, while in Europe and Asia, traders look to the TTF and JKM benchmarks to get a feel of what’s happening globally. It all boils down to trade flows and LNG agreements that let gas cross oceans, causing international prices to shift as global trade changes.
When U.S. prices come in lower than these international markers, it usually means our domestic production is robust and our infrastructure is efficient. In contrast, higher prices in regions like Europe can crop up from surging demand or tight storage during those cold spells. Think of it like your local grocery store running a sale while stores overseas charge more due to extra import costs.
An April 2025 outlook report pointed out that a recent uptick in LNG exports from the United States has widened the gap between the Henry Hub and the TTF and JKM indices. As LNG moves across continents, its impact on local prices grows stronger, influencing both market mood and investor decisions.
Key regional factors include the role of trade in changing price gaps, infrastructure improvements that boost supply reliability, and seasonal demand shifts affecting domestic versus international markets.
| Region | Benchmark |
|---|---|
| U.S. | Henry Hub |
| Europe | TTF |
| Asia | JKM |
All in all, these comparisons clearly show how global trade and local factors team up to set a positive tone in the natural gas market.
Investment Strategies and Risk Management in Natural Gas Markets
Managing risk in the natural gas market is a bit like setting up a good game plan for your favorite team. Experts say that using natural gas ETFs, which means buying a slice of a diverse group of assets, and futures contracts can help you cover your bets when prices start to swing. This approach gives you an easy way to spread out your investments, so you’re not putting everything in one basket.
One helpful trick is hedging. In plain language, hedging means taking positions that usually move in the opposite direction to your main investments. For example, if you think natural gas prices might drop, futures contracts can help balance out any losses. People often compare methods that rely on charts with those based on company fundamentals. You can check out more on technical analysis versus fundamental analysis at this link: https://allbestfinance.com?p=388.
Trading volume is another key point. When lots of shares are being traded, it signals a busy market with fast-changing prices. Looking at these volumes can give you clear hints about what other investors are thinking and when shifts might be on the horizon.
Risk management frameworks offer clear, actionable steps to keep you steady. Here are a few easy tips to keep in mind:
- Monitor both natural gas ETFs and futures contracts; they work together to balance your portfolio.
- Use hedging strategies to protect your investment from unexpected price drops.
- Track trading volume trends to catch early signals of market shifts.
- Compare U.S. commodity benchmarks with other key indicators for a full view of the market.
Futures volatility analysis shows that natural gas prices can swing more than expected. Investors use these insights to know the best moments to buy or sell. These practical strategies help you navigate the ups and downs, keeping you on track even when the market gets a bit turbulent.
Final Words
In the action, this post traced natural gas price trends from a historical timeline to current market moves. It explained how supply and demand, spot and futures markets, and even geopolitical and seasonal shifts shape these prices. We also explored regional differences and practical strategies for risk management. Each section painted a clear picture that helps simplify complex market insights. With this thorough overview, you’re well-equipped to make informed decisions and keep a positive outlook for the future.

